ClioVis is a unique visualization tool that helps you:
Connect
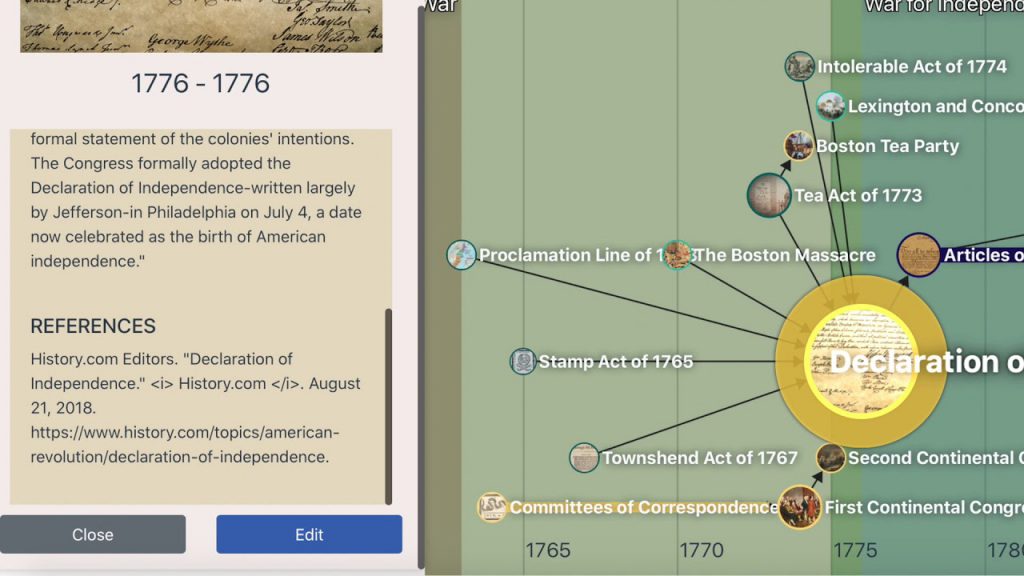
Gain a deeper understanding of the connections at play across different time periods or processes.
Cite
Conduct and cite your primary or secondary source research.
Collaborate
Collaborate with peers via real-time multi-user editing and group chat.
Categorize
Categorize events and justify connections—critical steps in fostering higher-level thinking skills.
Present
Present via our built-in presentation tool; there is no need to export to Powerpoint or Prezi.
ClioVis fosters student-centered learning in both synchronous and asynchronous environments. It is a versatile tool that enables interactive Digital Humanities projects, museum exhibits, or public-facing projects. STEM Students can also use ClioVis. All information in ClioVis can be exported as Word docs, CSV files, or fully interactive visualizations.
There are free and paid versions of ClioVis available. The free version still enables students to create a project and build timelines, it just limits collaboration. We ask people who can to “cost-share” with us. [e.g.: ClioVis also supports student interns — grad and undergrad.] So feel free to reach out for a free tutorial.
Create engaging assignments that help students stay engaged with course material and succeed in class.
Use ClioVis to help students make connections that help them differentiate between causation and correlation. You can have students “reverse engineer” readings to help them discern an author’s methodology, with a particular focus on how they build their argument. ClioVis is also an excellent tool for developing citation skills as students cannot add an event to the timeline unless they have a source.
Provide your students with a fun and unique platform that facilitates group projects and helps them create dynamic presentations.
Since ClioVis is web based, users can collaborate on a single project in real time. Its presentation mode allows students to project an interactive timeline to an audience without having to resort to external presentation software such as PowerPoint.
Demonstrate student success that aligns with department guidelines. Using dynamic, engaging platforms can also help attract majors to your discipline.
ClioVis provides an ideal platform for building assessments that demonstrate student learning. Educators can design timeline assignments that correspond with assessment goals used by departments to demonstrate student success. When students see all they accomplish on the platform, they get excited by the discipline.
Build the ultimate study toolkit, get better grades.
Students can use ClioVis to outline lectures and readings, creating an ongoing visual “network map” of an entire course. You can plot answers to research-based questions, using the ClioVis visualization process to master difficult material which means you earn higher grades. When you’ve completed mapping your material you can export your research in a text format to turn in as an assignment or use as a first draft of a paper.
ClioVis is designed to help students think about workflow (e.g. the steps they need to take to learn something.) It’s designed to help students break down longer projects into discreet parts, then “build out” the connections between those parts. The software then helps them visualize to the entire process as they move along.
Study smarter, not harder. Collaborate on and present your group project. Build your community.
ClioVis is an ideal platform for group projects. Its collaboration tools allow everyone to work on the same timeline and its built-in presentation mode lets you project your work to an audience in an interactive format that provides a refreshing break from the usual PowerPoint routine. Working with others helps you build your community and learn from your peers.
Listen to how one student describes their experience using ClioVis
ClioVis is the perfect tool to help you discover unexpected connections between historical events or to use for class presentations in a variety of different courses.
Perform and visualize complex network analysis to make your results easier to understand.
Advanced students can use ClioVis to assemble and visualize network analysis for dissertations and long-term research projects. Genealogists can use it for family history projects.
Build large timelines to synthesize your research material.
ClioVis is particularly adept at organizing large datasets into visually useful configurations. Researchers can use it both to store information and to uncover connections or trends in their data. ClioVis is also an ideal tool for genealogists looking to create visually appealing timelines for family or community genealogy projects.
ClioVis projects can be embedded as interactive timelines, making them ideal enhancements for your e-portfolio. The built-in presentation mode allows you to project your work to an audience in an interactive format that avoids the usual static PowerPoint routine.
ClioVis is an ideal platform to expand the use of your library’s resources. Watch our two explainers below to see how ClioVis can help your student and faculty patrons: